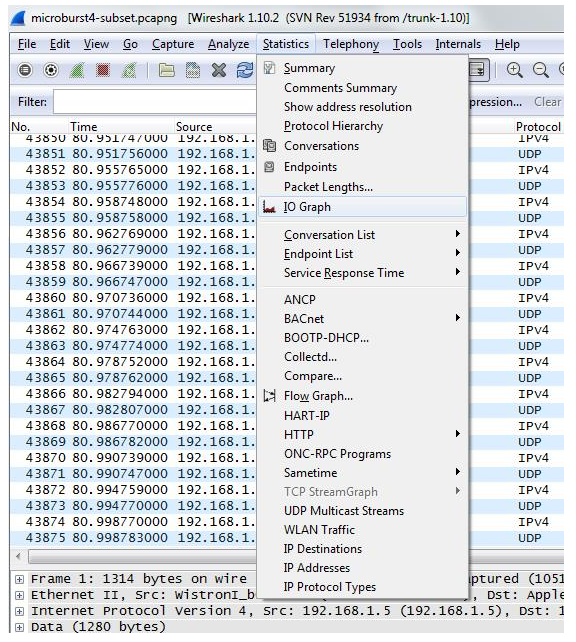
Output drops are usually caused by congested interfaces. If you are seeing output drops increment, but the overall traffic utilization of that interface is low, you are most likely experiencing some type of bursty traffic. A microburst of traffic can overload the physical link capacity and buffer space on a scale of milliseconds causing drops even though the overall utilization is low.
The information below will help identify if the output drops on the interface are occurring due to spikes of traffic.
A traffic burst can cause output drops on the interfaces even when the interface is not being utilized at the maximum capacity.
For us to identify what kind of traffic and which packets are being dropped we are going to use a port mirroring session and check out the capture on Wireshark.
set ethernet-switching-options analyzer JTAC input egress interface xe-0/0/0.0
set ethernet-switching-options analyzer JTAC output interface xe-0/0/47.0
Start the capture and let it run long enough to try to get the suspected burst event (if you have an approximate time in which the event occurs that would narrow the time of the capture)

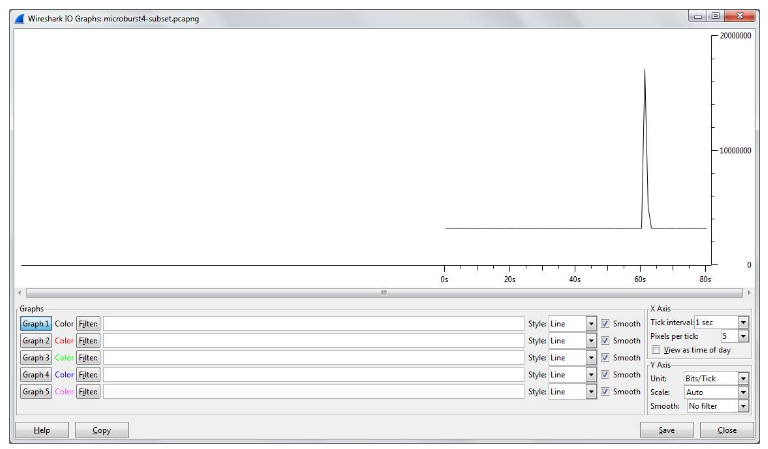
Next we need to look at our X and Y Axis values. By default the X Axis is set to a “Tick Interval” of 1 second but if no drops are seen on that interval is best to select an interval lower than 1 second (.01 or .001), the shorter the time, the more accurate it will be.

Change the “Y-Axis” Unit from the default “Packets/Tick” to “Bits/Tick” because that is the unit the interface is reporting Wireshark will let you click on any point in the graph to view the corresponding packet in the capture. If you click on the top of the spike in the graph, the main Wireshark window will jump to that packet. Once you identify the source of the traffic causing the burst you can do some further research into what application(s) are causing the spike and continue the troubleshooting.