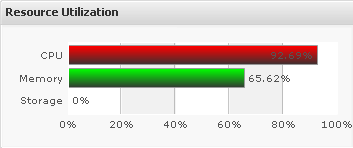
The Branch solution devices in the SRX family show high CPU utilization even when there is no traffic on the device.
The information below explains how CPU utilization is shown in J-Web and CLI, and why CPU utilization is shown as high, with examples.
Note: This article applies to Junos OS 10.0 and earlier. After Junos OS 10.0, there is a separate display for the control core and data core on the J-Web dashboard.
On the J-Web Dashboard tab, CPU utilization shows over 90% like below even there are no sessions and no traffics.
The “top” command on the shell or “show system processes extensive no-forwarding” commands on CLI report that CPU utilization is over 100% like below.
root> show system processes extensive no-forwarding

last pid: 3140; load averages: 12.19, 11.75, 9.50 up 0+00:26:40 15:36:04
132 processes: 25 running, 96 sleeping, 11 waiting

Mem: 118M Active, 244M Inact, 999M Wired, 145M Cache, 112M Buf, 436M Free
Swap:

  PID USERNAME THR PRI NICE    SIZE     RES STATE  C   TIME WCPU  COMMAND
  960 root      13  76    0    934M  37228K select 0 255:20 1027.69% flowd_octeon_hm
   22 root       1 171   52      0K     16K RUN    0  16:32 66.16% idle: cpu0
 3107 root       1  80    0  36308K  12012K select 0   0:00 0.73% cli
   19 root       1 171   52      0K     16K RUN    3   3:31 0.00% idle: cpu3
   20 root       1 171   52      0K     16K RUN    2   3:30 0.00% idle: cpu2
   11 root       1 171   52      0K     16K RUN    b   2:36 0.00% idle: cpu11
   12 root       1 171   52      0K     16K RUN    a   2:36 0.00% idle: cpu10
   13 root       1 171   52      0K     16K RUN    9   2:35 0.00% idle: cpu9
   14 root       1 171   52      0K     16K RUN    8   2:35 0.00% idle: cpu8
   15 root       1 171   52      0K     16K RUN    7   2:35 0.00% idle: cpu7
   16 root       1 171   52      0K     16K RUN    6   2:35 0.00% idle: cpu6
   18 root       1 171   52      0K     16K RUN    4   2:35 0.00% idle: cpu4
   17 root       1 171   52      0K     16K RUN    5   2:35 0.00% idle: cpu5
   21 root       1 171   52      0K     16K RUN    1   2:35 0.00% idle: cpu1
    4 root       1  -8    0      0K     16K -      0   1:50 0.00% g_down
   51 root       1  -8    0      0K     16K mdwait 0   0:42 0.00% md0
  910 root       1  76    0  24056K  14556K select 0   0:26 0.00% chassisd
   23 root       1 -20 -139      0K     16K RUN    0   0:06 0.00% swi7: clock
1. Why is the CPU utilization of SRX branch devices shown high on J-Web?
- J-Web displays the instantaneous CPU utilization of the complete system, which includes control core and the data core.
- It shows always high because the data core utilization is nearly 100%. If so, refer to the last bullet in this step.
- To check control core, enter the CLI command “show chassis routing-engine”:
root> show chassis routing-engine
Routing Engine status:
Temperature                     43 degrees C / 109 degrees F
CPU temperature                 43 degrees C / 109 degrees F
DRAM                          2048 MB
Memory utilization              66 percent
CPU utilization:
 User                           15 percent
 Background                      0 percent
 Kernel                         10 percent
 Interrupt                       0 percent
 Idle                           75 percent
Model                              RE-SRXSME-SRE6
Serial ID                          AAAB8742
Start time                         2009-07-02 19:11:31 KST
Uptime                             16 hours, 3 minutes, 18 seconds
Last reboot reason                 could not be determined
Load averages:                     1 minute  5 minute  15 minute
                                      11.78     11.41      11.31
- To check each data core, enter the command “top –H” in the shell.
root@% top -H
last pid: 2456; load averages: 11.42, 11.27, 11.26 up 5+03:28:44 16:22:54
72 processes: 13 running, 58 sleeping, 1 zombie
CPU states: % user, % nice, % system, % interrupt, % idle
Mem: 84M Active, 184M Inact, 998M Wired, 206M Cache, 112M Buf, 501M Free
Swap:

PID USERNAME PRI NICE   SIZE    RES STATE  C   TIME   WCPU COMMAND
990 root     139    0   935M 38704K CPU1   1 1374.0 93.21% flowd_octeon_hm
990 root     139    0   935M 38704K CPU3   3 1374.0 92.48% flowd_octeon_hm
990 root     139    0   935M 38704K CPU2   2 1374.0 92.48% flowd_octeon_hm
990 root     139    0   935M 38704K CPU11  b 1374.0 92.48% flowd_octeon_hm
990 root     139    0   935M 38704K CPU10  a 1374.0 92.48% flowd_octeon_hm
990 root     139    0   935M 38704K CPU9   9 1374.0 92.48% flowd_octeon_hm
990 root     139    0   935M 38704K CPU8   8 1374.0 92.48% flowd_octeon_hm
990 root     139    0   935M 38704K CPU7   7 1374.0 92.48% flowd_octeon_hm
990 root     139    0   935M 38704K CPU6   6 1374.0 92.48% flowd_octeon_hm
990 root     139    0   935M 38704K CPU5   5 1374.0 92.48% flowd_octeon_hm
990 root     139    0   935M 38704K CPU4   4 1374.0 92.48% flowd_octeon_hm
990 root      80    0   935M 38704K RUN    0 1374.0  7.47% flowd_octeon_hm
990 root      76    0   935M 38704K select 0 1374.0  0.00% flowd_octeon_hm
946 root      76    0 24580K 15048K select 0 121:18  0.00% chassisd
983 root      76    0 10192K  6332K select 0   3:30  0.00% jdiameterd
973 root      76    0 12536K  8676K select 0   2:29  0.00% l2ald
984 root      76    0 10748K  7144K select 0   2:06  0.00% utmd
995 root      76    0 17512K 13944K select 0   1:45  0.00% snmpd
943 root      76    0  2608K  1204K select 0   1:41  0.00% bslockd
2. Why is the utilization of data core always high even there are is no traffic and sessions?
- The data core runs in a tight loop always to process as soon as a packet arrives instead of using interrupts to process packets whenever it arrives.
3. Why is the “top” and “show system processes extensive no-forwarding” command reporting that CPU utilization is over 100%?
- The forwarding daemon runs nearly 100% in a tight loop in data cores (1..n) and the JUNOS accounts time spent in both cores against forwarding daemon.
- To check per core utilization, use “top –H” instead of using “top”.
