The procedure outlined in this article describes the process of enabling and collecting the required client-side log files, which are required by Juniper Support, to troubleshoot the following types of Network Connect (NC) or Junos Pulse VPN issues:
- Resource Access issues
- Performance issues
- Install issues
- Launch\Connection issues
- Credential Provider\Gina Issues
Note: Junos Pulse combines the features of Odyssey Access Client for LAN access, Network Connect (NC) or the SRX client software for WAN access, and WX client software for application acceleration services.
Users of mobile devices (smartphones) can also enable Junos Pulse for secure connectivity to a Secure Access (SA) Appliance. In this case, please note that any and all references made to Junos Pulse (Pulse) within the contents of this article specifically refer to the feature which allows for a Layer 3 VPN connection to the Junos Pulse Secure Access (SA) Appliance on a Windows Desktop.
The required client side logs for troubleshooting Network Connect or Junos Pulse VPN issues.
Prerequisites
- Enable the corresponding server side logs.
- If you are having a resource access or performance issue, obtain a Packet Sniffer.
Packet Sniffers are programs for capturing live traffic on a client network. There are several packet sniffers available today for a price and others available for free for download and use. Juniper Networks does not assume any responsibility for the selection of or use of these third party sites and products, so we do ask that you take the time to evaluate and gain the necessary approval needed to install such a program on the designated client machine and Application Server (if possible) prior to starting the log gathering process.
Please ensure that the packet sniffer which you chose will allow you to save the TCP capture in either pcap or tcpdump(.dmp) format. Such a packet sniffer will be required by Juniper Support in order to validate the traffic pattern(s) and behavior on the client machine’s local network.
While Juniper Networks does not advocate or condemn the use of any such packet sniffer in particular, we commonly suggest the use of Wireshark as the full version is freely available for commercial use and it is supported on a wide range of platforms (Windows, Mac OS, Linux, and so forth).
Microsoft Network Monitor is especially useful in cases where Wireshark is unable to capture on the local adapter (this is commonly a problem with PPP and Aircard adapters). For Apple Operating Systems (OS), we also commonly suggest the use of “tcpdump” which is a command line tool that is included with all versions of Mac OS X.
Enable client side logging on the SA
If you do not enable client side logging on the SA device, then the corresponding client log files described below will NOT be generated for Network Connect or Pulse. Client-side logging is useful for debugging problems with an SA Series Appliance client-side feature such as Network Connect. When you enable logging for Network Connect/VPN Tunneling, the Appliance writes a log to any client computer that uses either Network Connect or Junos Pulse. These settings are global, which means that the SA Series Appliance writes a log file to all clients that use the enabled feature.
The Appliance then appends to the log file each time the feature is invoked during subsequent user sessions. Please note that logging on the client will be automatically enabled at level 3 (which is typically all that is required; the level will be changed if needed).
To enable Client-Side logging:
1.In the Admin Console go to System > Log/Monitoring > Client Side Logs > Settings.
2.Select the Network Connect checkbox.
3.Click Save Changes.
Instructions
The following detailed instructions are for collecting a packet sniffer (If applicable to your issue) on Windows by using Wireshark and on Mac OS using the built-in tcpdump. If you have opted to use a packet sniffer other than Wireshark or tcpdump or using the Linux OS, refer to the the vendor instructions for enabling the packet capture on the appropriate interface.
Note: Ensure that you have enabled the corresponding server side logs , before proceeding with the following procedure.
STEP 1: Enable Packet Sniffer on the Local Client Adapter:
Windows (Wireshark)
1.Open the command prompt and launch Wireshark
- Windows Vista/Windows 7: Select Start and type wireshark in the search bar
- Windows XP: Select Start > Run and type wireshark in the run prompt
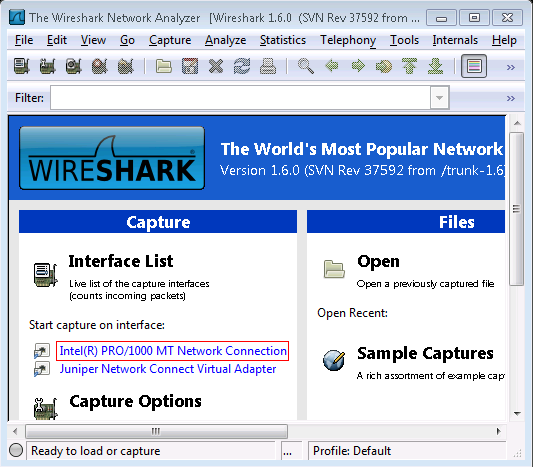
2.Go to Interface List > Start Capture > Start capture on interface
3.Select the Local Client Adapter in order to start the capture.
Mac OS (tcpdump)
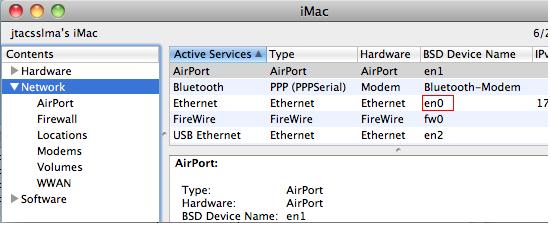
To determine the name of your Local Client Adapter enable tcpdump for this interface:
1.Browse to Applications > Utilities
2.Select System Profiler and make a note of the BSD Device Name for your Local Client Adapter. In our example, we will be capturing on the en0 adapter.
3.Browse to Applications > Utilities
4.Select Terminal.app
5.Type
sudo tcpdump –i en0 –s 0 –B 524288 –w /<directory_path>/EN0.pcap
and select enter on your keyboard. Note: This command requires the local administrator password for your machine.
STEP 2: Enable Packet Sniffer on the Juniper Virtual Adapter:
Windows (Wireshark)
1.Open the command prompt:
- Windows Vista/Windows 7: Select Start and type wireshark in the search bar
- Windows XP: Select Start > Run and type wireshark in the run prompt
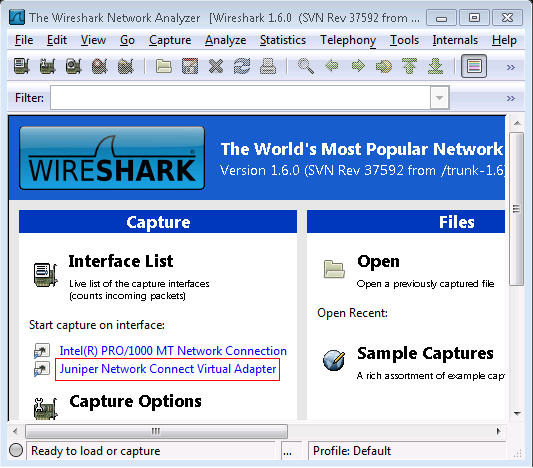
2.Go to Interface List > Start Capture > Start capture on interface
3.Select the Juniper Virtual Adapter in order to start the capture.
NOTE: If Wireshark was installed before you installed NC\Pulse, then the Juniper Virtual Adapter may not register with Wireshark until after you perform a reboot.
Mac OS (tcpdump)
1.Login to Network Connect as you will not be able to capture on the Juniper Virtual Adapter (jnc0) until you connect.
2.Browse to Applications > Utilities
3.Select Terminal.app
4.Type
sudo tcpdump –i jnc0 –s 0 –B 524288 –w /<directory_path>/JNC0.pcap
and select enter on your keyboard
STEP 3: Recreate the issue
STEP 4: Stop Local Client Adapter capture and Save
After you have recreated the issue, stop the Packet Sniffer on the Local Client Adapter and save it in pcap format
Windows (Wireshark)
To stop Wireshark on the Local Client Adapter and save it in pcap format:
1.In the Wireshark program select Capture > Stop
2.Then select File > Save As…
3.Save the capture as LAN_Adapter.pcap
Mac OS (tcpdump)
To stop tcpdump on the Local Client Adapter and save it in pcap format:
On the terminal, hold down the control key and type the letter c
NOTE: The file will be located in the <directory_path> you have specified. If you did not specify a directory path, then the file will be located in the directory where the command prompt was first opened in; usually the user’s home directory.
STEP 5: Stop Virtual Adapter capture and Save
Next, stop the Packet Sniffer on the Juniper Virtual Adapter and save it in pcap format
Windows (Wireshark)
To stop Wireshark on the Juniper Virtual Adapter and save it in pcap format:
1.In the Wireshark program select Capture > Stop
2.Then select File > Save As…
3.Save the capture as NC_Adapter.pcap
Mac OS (tcpdump)
To stop tcpdump on the Juniper Virtual Adapter and save it in pcap format:
On the terminal, hold down the control key and type the letter c
NOTE: File will be located in the <directory_path> you have specified. If you did not specify a directory path, then the file will be located in the directory where the command prompt was first opened in. Usually the user’s home directory.
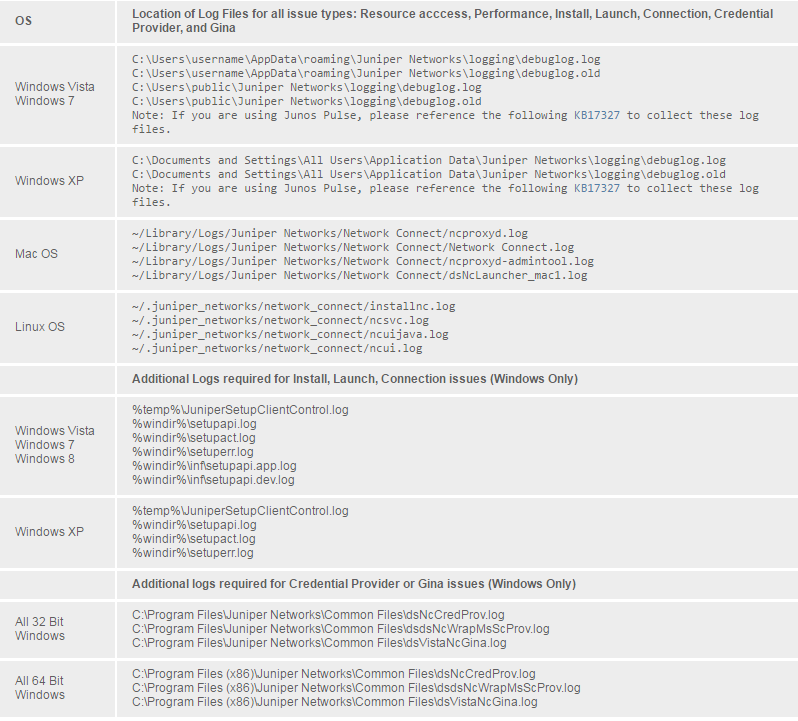
STEP 6: Collect Client-Side Log Files
After you have recreated the issue, collect the newly created Client-Side Log files.

Step 7: Send the data to support
Once the data has been collected, open a case with your technical support representative. To open a case with JTAC, use either of the following methods:
- Web (online): Click Create Case, and choose the ‘Technical Support Case’ radio button.
- Phone: Call 1-888-314-5822 (US and Canada) or 1-408-745-9500 (outside the United States).


